
For more than two decades, search engine optimization reporting has remained shackled to surface-level vanity metrics: aggregate keyword ranking positions, raw organic impression counts, and superficial traffic estimates. In the modern enterprise C-suite, chief marketing officers, chief revenue officers, and financial controllers dismiss ranking screenshots as unverifiable noise; they demand rigorous econometric attribution, measurable customer acquisition economics, and verifiable pipeline revenue. Measuring the true return on investment (ROI) of organic search requires bridging the engineering divide between raw web crawler telemetry and enterprise cloud data warehouses. This definitive master engineering guide details how to build an unshakeable, enterprise-grade SEO analytics and reporting infrastructure across Google Analytics 4 (GA4), the Google Search Console (GSC) API, Google BigQuery, and automated Looker Studio executive dashboards.
The Enterprise Attribution Dilemma:
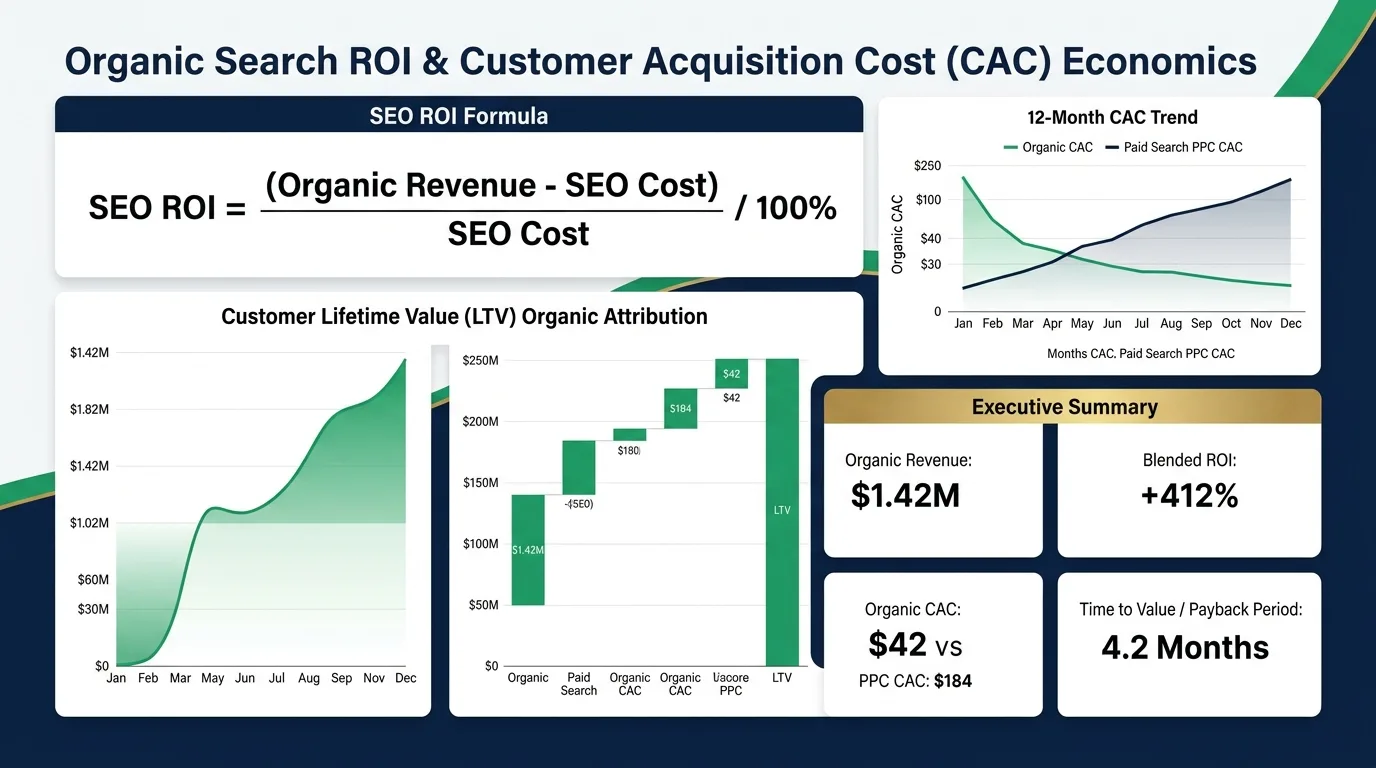
In complex B2B sales cycles and multi-device consumer journeys, organic search rarely functions as a solitary last-click transactional channel. Over 68% of enterprise organic search revenue originates from assisted conversions—where high-intent technical pillar articles introduce the prospective buyer weeks before paid social retargeting, email nurture workflows, or direct brand navigation captures the final checkout or demo request.

Figure 1: Multi-Touch Organic Search Attribution Funnel — Mapping First-Touch Discovery to Customer Lifetime Value (LTV).
Chapter 1: The Fallacy of Vanity Metrics vs. Commercial Enterprise Value
Most monthly SEO reports fail to convince executive boards because they report on operational volume rather than economic yield. Organic traffic volume that does not translate into pipeline generation, qualified accounts, or cash flow is merely an expense against server infrastructure. Understanding the structural distinction between vanity telemetry and commercial enterprise value is the foundation of modern search performance engineering.
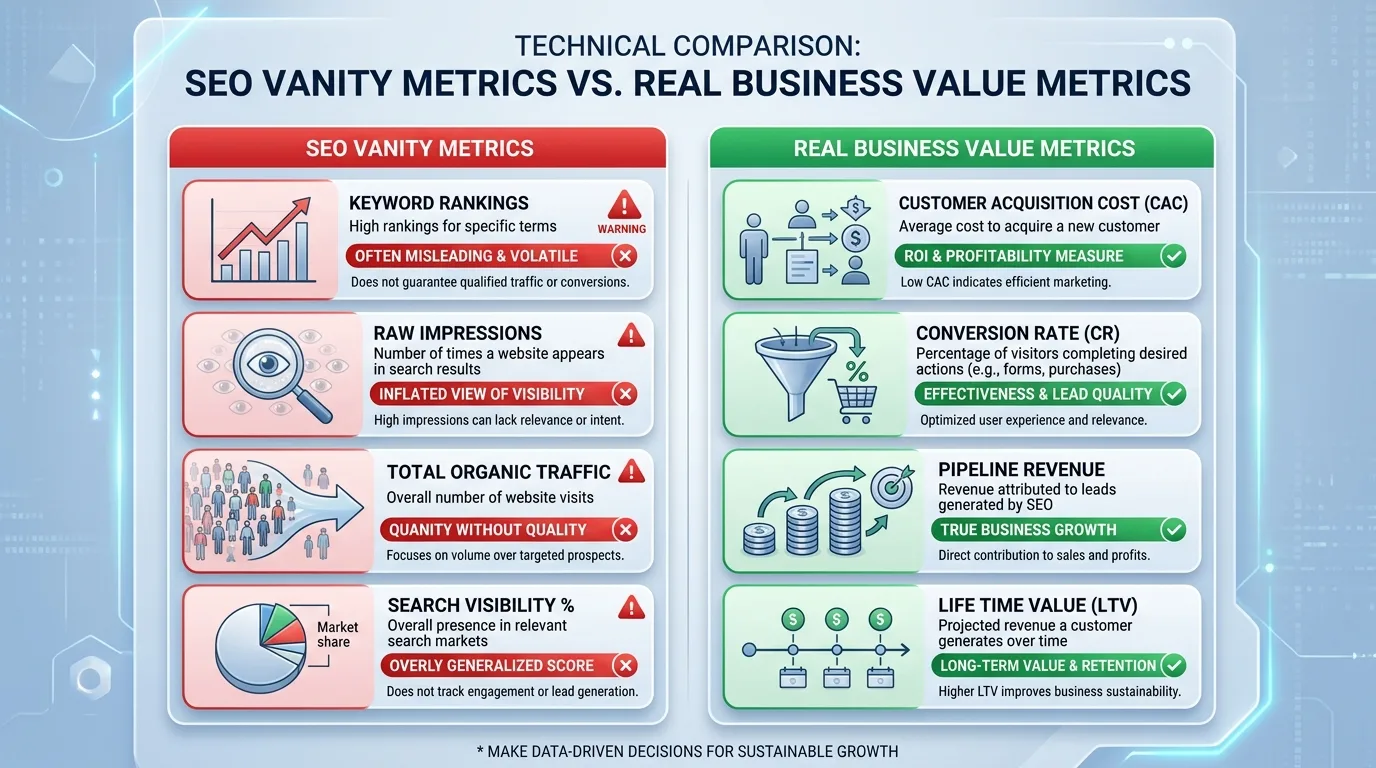
Figure 2: Vanity Metrics versus Commercial Value Matrix — Aligning Search Performance with Executive Financial KPIs.
When presenting search data to executive stakeholders, your metrics must align with the language of the general ledger. Vanity metrics focus on ranking positions and click totals; commercial metrics focus on acquisition velocity, pipeline contribution, and capital efficiency.
| Dimension | Traditional Vanity Metric | Modern Commercial Metric | Strategic Value & Actionability |
|---|---|---|---|
| Rankings | Average Keyword Position across 5,000 queries | Non-Brand Share of Voice (SOV) in Commercial Clusters | Focuses content engineering budgets strictly on high-intent, revenue-generating clusters. |
| Traffic | Total Raw Organic Sessions | Qualified Engaged Sessions on Commercial URLs | Filters out accidental navigational queries, scraping bots, and unmonetized blog noise. |
| Conversion | Last-Non-Direct Click Leads | Data-Driven Multi-Touch Pipeline Contribution | Demonstrates how top-of-funnel technical guides nurture multi-million dollar deals. |
| Efficiency | Cost-per-Click (CPC) Equivalent Savings | Blended CAC vs. Organic Payback Period (Months) | Directly informs annual executive capital allocation and headcount justification. |
Chapter 2: Streaming Search Console Data to Google BigQuery at Scale
The standard Google Search Console web UI imposes an arbitrary 1,000-row table limit and stores historical performance for only 16 months. For an enterprise domain generating millions of long-tail queries, the native web UI conceals over 95% of your keyword footprint due to row truncation and privacy filtering. Google's native BigQuery Bulk Data Export completely bypasses all UI limitations, streaming daily raw, un-sampled query and URL logs directly into a petabyte-scale cloud data warehouse.
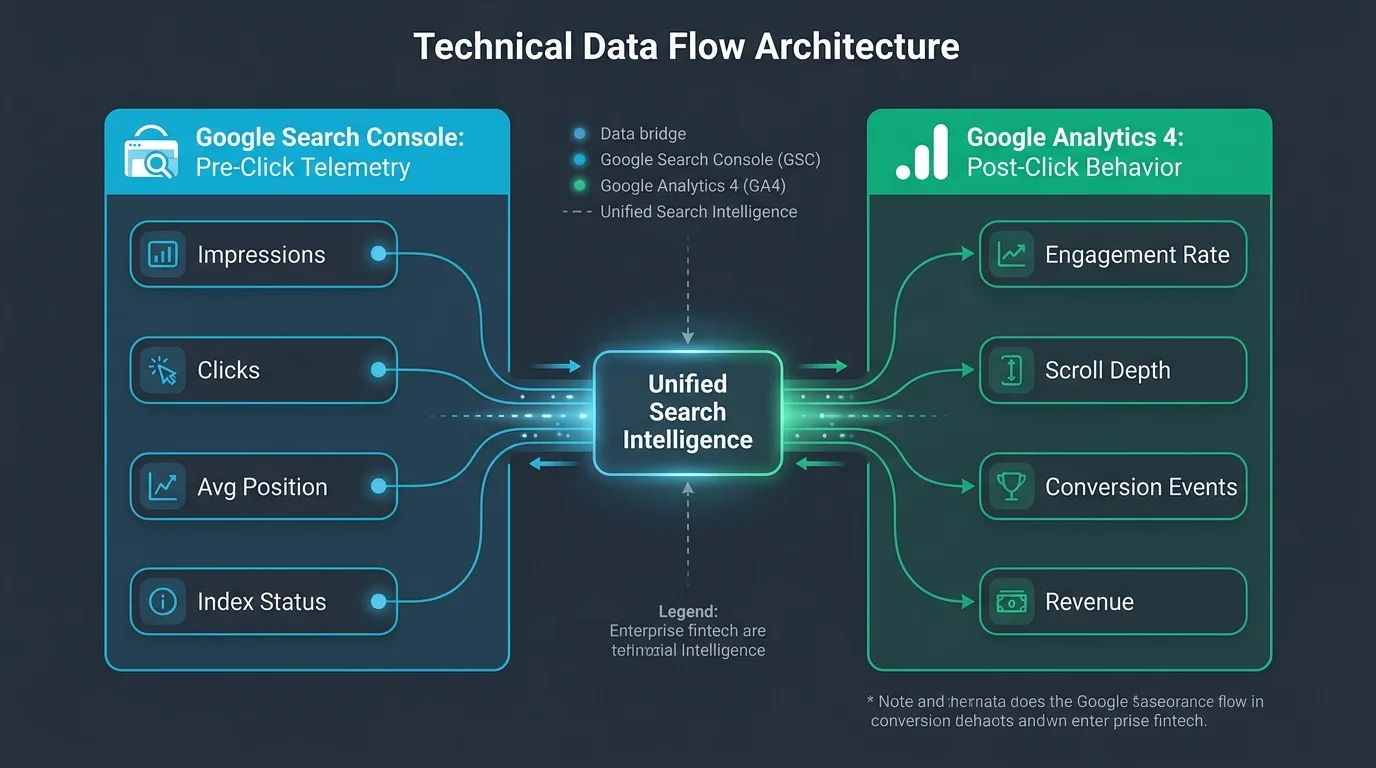
Figure 3: Modern Data Warehouse Architecture — Continuous GSC Bulk Export to BigQuery joined with GA4 BigQuery Event Streams.
1. Activating and Provisioning BigQuery Bulk Data Export
Setting up the automated export requires provisioning a Google Cloud Platform (GCP) project and configuring GSC bulk export settings:
- Create a dedicated BigQuery dataset named
searchconsolewithin your preferred regional cloud storage zone (e.g.,us-central1oreurope-west1). - Grant the official Search Console service account (
search-console-data-export@system.gserviceaccount.com) BigQuery Data Editor permissions on your target GCP project. - Navigate to GSC Settings > Bulk Data Export, enter your Cloud Project ID, and initialize the automated daily ingestion pipeline.
- Within 48 hours, BigQuery will populate two primary partitioned tables:
searchdata_url_impression(URL-level performance) andsearchdata_site_impression(site-level aggregate metrics).
2. High-Impact SQL Analytics Queries on BigQuery
Once GSC data streams into BigQuery, you can execute complex analytical SQL queries that are impossible in standard SEO tools. For example, identifying high-potential “striking distance” queries where your pages rank between position 4 and 10 with massive impressions:
-- Identify High-Opportunity Striking Distance Queries (Position 4-10)
SELECT
    query,
    url,
    SUM(impressions) AS total_impressions,
    SUM(clicks) AS total_clicks,
    ROUND((SUM(clicks) / NULLIF(SUM(impressions), 0)) * 100, 2) AS ctr_pct,
    ROUND(AVG(sum_position / NULLIF(impressions, 0)), 1) AS avg_position
FROM `project_id.searchconsole.searchdata_url_impression`
WHERE data_date >= DATE_SUB(CURRENT_DATE(), INTERVAL 30 DAY)
  AND is_anonymized_query IS FALSE
GROUP BY query, url
HAVING avg_position BETWEEN 4.1 AND 10.0
   AND total_impressions > 2500
ORDER BY total_impressions DESC
LIMIT 50;
Another high-value query identifies cannibalization conflicts—where multiple distinct URLs from your domain rank and compete for the exact same organic search query across the trailing 60 days:
-- Detect Severe Keyword Cannibalization Across Multiple URLs
WITH QueryURLStats AS (
    SELECT
        query,
        url,
        SUM(clicks) AS clicks,
        SUM(impressions) AS impressions,
        ROUND(AVG(sum_position / NULLIF(impressions, 0)), 1) AS avg_pos
    FROM `project_id.searchconsole.searchdata_url_impression`
    WHERE data_date >= DATE_SUB(CURRENT_DATE(), INTERVAL 60 DAY)
      AND is_anonymized_query IS FALSE
    GROUP BY query, url
)
SELECT
    query,
    COUNT(DISTINCT url) AS competing_urls_count,
    ARRAY_AGG(STRUCT(url, clicks, impressions, avg_pos) ORDER BY impressions DESC) AS competing_pages
FROM QueryURLStats
GROUP BY query
HAVING competing_urls_count > 1
   AND SUM(impressions) > 1000
ORDER BY competing_urls_count DESC, SUM(impressions) DESC
LIMIT 25;
The Permanent Data Retention Advantage:
By streaming Search Console records into BigQuery, you eliminate the 16-month historical data cliff. You gain permanent, immutable multi-year archives allowing your data science team to conduct authentic 3-year, 5-year, and macro-economic seasonal regression analyses that reveal true long-term organic growth.

Chapter 3: GA4 Advanced Explorations and Event Architecture for SEO
Transitioning from Universal Analytics to Google Analytics 4 (GA4) confused many search professionals because GA4 replaced session-based pageviews with an event-driven data model. In GA4, every hit is an independent event with contextual parameters. Mastering custom GA4 Explorations and deploying granular custom event parameters unlocks deep insight into organic reader engagement and commercial micro-conversions.
1. Designing the Organic Landing Page Exploration
To evaluate the commercial efficiency of individual content hubs, configure a Free-Form Exploration with the following telemetry dimensions and metrics:
- Primary Dimensions:
Landing page + query string,Session default channel group(filtered to “Organic Search”), andDevice category. - Core Metrics:
Active users,Engaged sessions,Engagement rate,Average engagement time per session,Key events (Conversions), andSession key event rate. - Custom Dimension Breakdowns: Segment by author, content cluster (e.g.,
category_name), and published date cohort to track content decay cycles.
2. Path Exploration: Mapping Post-Landing Trajectories
Using GA4 Path Explorations, trace what readers do after consuming an organic pillar page. Do they immediately bounce back to Google (indicating low satisfaction or unfulfilled intent), or do they click internal links to view pricing pages, product documentation, or case studies?
# Key Post-Landing Trajectory Signals to Audit:
- • Secondary Page Flow: Percentage of organic visitors who transition from top-of-funnel guides to commercial transactional hubs.
- • Scroll Depth Milestones: Percentage of readers who reach the 75% and 90% scroll depth marks on long-form pillar articles.
- • Micro-Conversion Triggers: Clicks on inline code snippets, whitepaper downloads, calculator tool interactions, and newsletter signups.
- • Assisted Pipeline Velocity: Days to conversion between first organic touch and downstream demo scheduling.
3. Implementing Content Micro-Conversion Telemetry
Standard GA4 pageviews do not measure active engagement. Implement custom event listeners via Google Tag Manager (GTM) to transmit high-value reading telemetry:
// Track User Code Copy Actions on Technical Documentation
document.querySelectorAll('pre code').forEach((codeBlock) => {
    codeBlock.addEventListener('copy', () => {
        window.dataLayer = window.dataLayer || [];
        window.dataLayer.push({
            event: 'code_snippet_copied',
            article_title: document.title,
            code_language: codeBlock.className || 'unknown',
            article_url: window.location.pathname
        });
    });
});
Chapter 4: Statistical SEO Split-Testing (Matched-Pair A/B Testing)
In modern software engineering, product teams never ship frontend changes without rigorous A/B split testing. Yet SEO teams routinely rewrite thousands of title tags, alter heading structures, or deploy schema across entire subdirectories with zero statistical validation. Implementing programmatic SEO split-testing prevents catastrophic ranking rollouts and proves causal business impact.
1. Methodology: Page-Level Matched-Pair Split Testing
Unlike user-split CRO tests (where user A sees variant A and user B sees variant B), SEO split-testing operates on matched pairs of pages because search engine crawlers must be served identical HTML without triggering cloaking penalties:
- Select a homogeneous page group (e.g., 2,000 e-commerce product collection pages or SaaS integration pages).
- Split the pages into two statistically identical buckets: Control Group (1,000 pages, untouched) and Variant Group (1,000 pages, modified title/schema/H1). Match pages based on historical 90-day click volume, impression distribution, and backlink authority.
- Deploy the change exclusively to the Variant Group via Edge SEO (Cloudflare Workers) or CMS template flags.
- Track daily organic clicks and impressions over a 30-to-60 day evaluation window using Bayesian time-series intervention models (such as Google's open-source
CausalImpactlibrary in Python or R).
# Python CausalImpact Execution Framework for SEO A/B Split Testing
import pandas as pd
from causalimpact import CausalImpact

# Load daily organic clicks for Control (y_control) and Variant (y_variant)
data = pd.read_csv("seo_ab_test_daily_clicks.csv", index_col="date")
pre_period = ["2026-07-01", "2026-08-15"]
post_period = ["2026-08-16", "2026-09-10"]

# Fit Bayesian Structural Time-Series Model
ci = CausalImpact(data, pre_period, post_period)
print(ci.summary())
ci.plot()

# A statistically significant positive divergence (p < 0.05) validates template rollout
When running matched-pair tests, monitor the synthetic control series against seasonal Google core updates. If both control and variant groups drop synchronously, the change is algorithmic rather than template-driven, protecting your engineering team from incorrect rollbacks.
Chapter 5: Multi-Touch Attribution Modeling and Server-Side Telemetry
To capture the authentic financial return of organic search, enterprise marketing organizations must move beyond naive single-touch models. First-touch models over-credit broad informational articles that never monetize, while last-touch models credit branded search or direct navigation, completely erasing the role of SEO in the buyer journey.
1. Econometric Multi-Touch Attribution Frameworks
Enterprise data teams implement three advanced attribution methodologies within BigQuery to evaluate channel synergies:
- Data-Driven Attribution (DDA): GA4's algorithmic default utilizes Shapley value cooperative game theory to measure the marginal contribution of each touchpoint across converting and non-converting journeys.
- Position-Based (U-Shaped) Attribution: Assigns 40% of conversion credit to the first touch (the organic discovery article), 40% to the lead conversion touch (the demo booking), and distributes the remaining 20% evenly across intermediate nurturing visits.
- Markov Chain Transition Matrices: A probabilistic state-transition model calculated in SQL/Python that evaluates the removal effect of organic search—calculating how conversion probabilities plummet if organic touchpoints are stripped from the marketing mix.
The Server-Side Tracking Imperative:
Client-side tracking scripts are increasingly blocked by browser privacy protections (Apple Safari ITP, Firefox ETP) and ad-blocking extensions, causing 15% to 30% under-reporting of organic conversions. Deploying Server-Side Google Tag Manager (sGTM) on Google Cloud Run preserves first-party cookie longevity and restores conversion fidelity.
2. Calculating Organic Customer Acquisition Cost (CAC) and Payback Period
Financial controllers assess organic search using two fundamental metrics: Blended Organic CAC and Payback Velocity. Calculating these metrics requires consolidating agency retainers, in-house payroll, tooling costs, and cloud infrastructure expenses:
Total Organic Spend = In-House Salaries + Content Production + Tooling (Ahrefs/Semrush) + Cloud (BigQuery/Cloud Run)
Organic CAC = Total Organic Spend / New Organic Paying Customers Acquired
Organic Payback Period (Months) = Organic CAC / (Average Monthly Gross Margin per Customer)
Unlike paid advertising, where customer acquisition halts the moment ad budgets cease, organic content assets generate compounding returns. A pillar guide published today continues acquiring enterprise deals for 36 to 48 months with zero incremental media spend, driving long-term Organic CAC down toward near-zero marginal costs.
Chapter 6: Leading vs. Lagging KPIs: The Strategic Balanced Scorecard
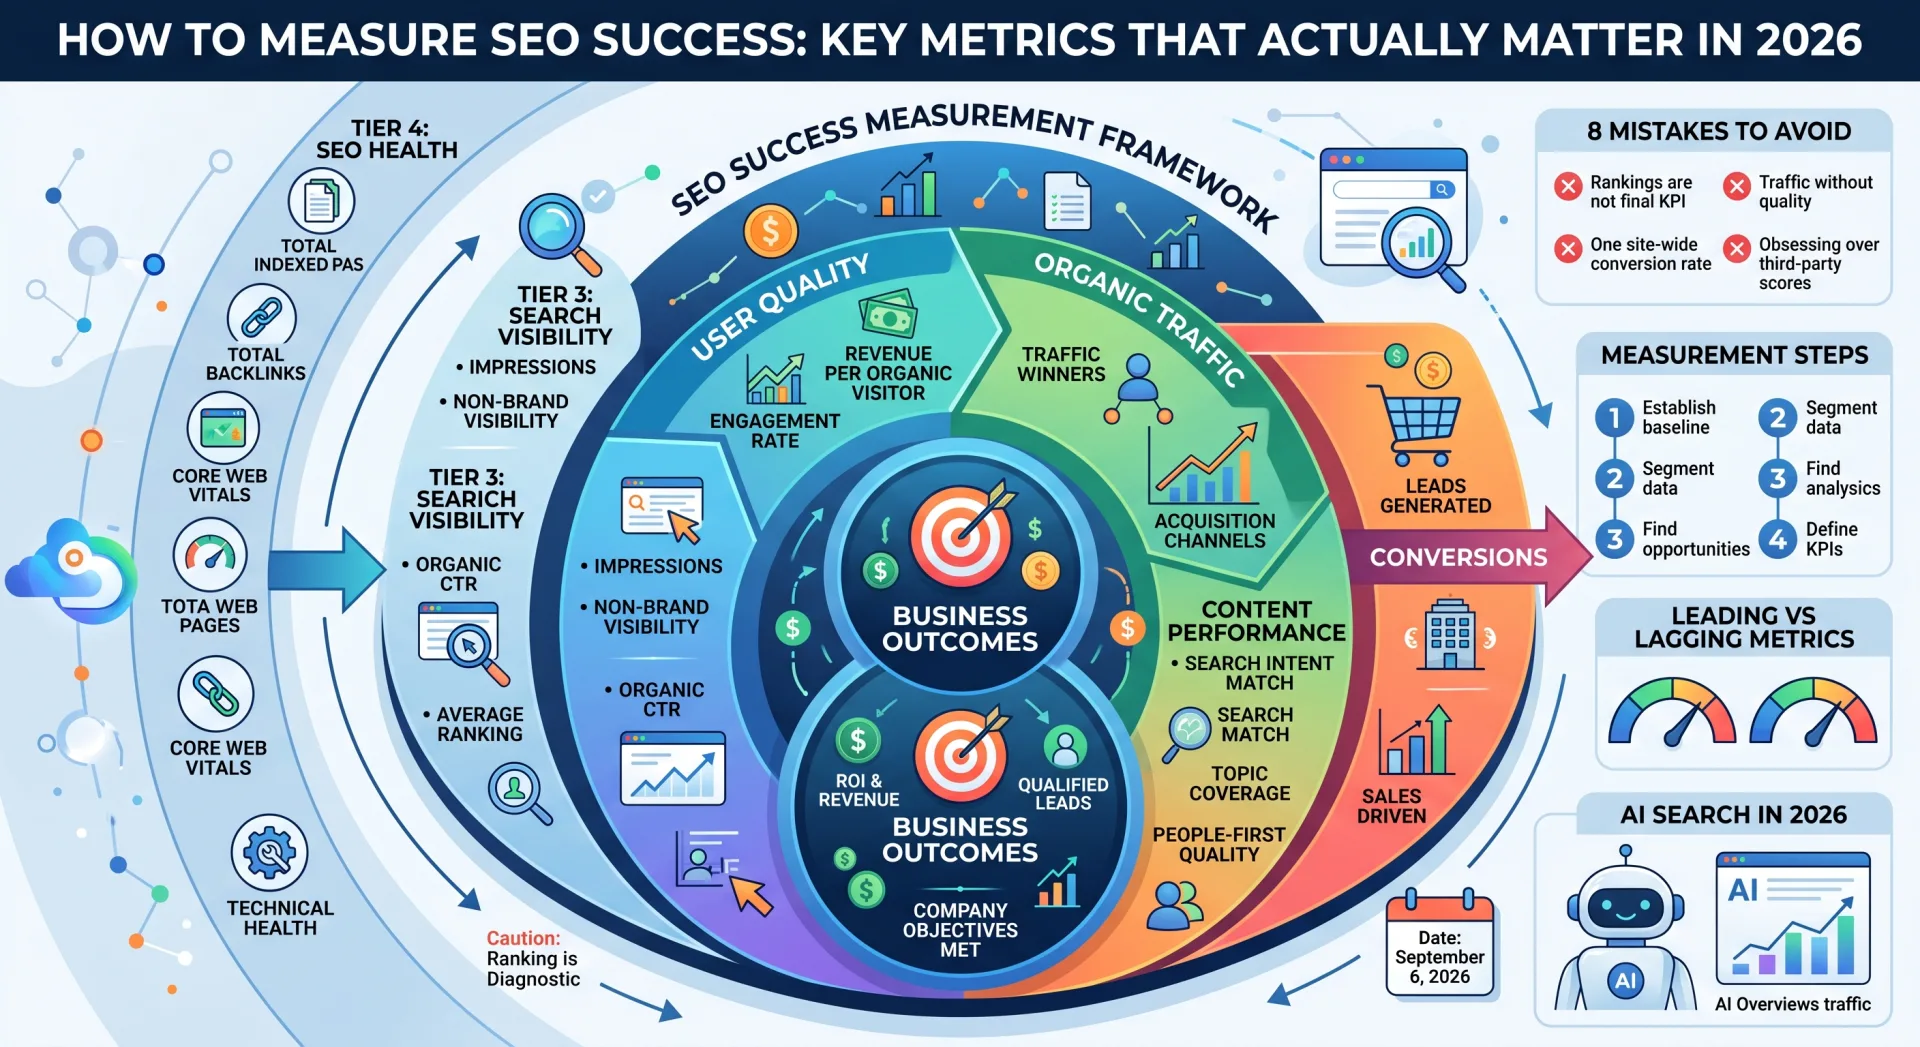
Presenting executive reports that consist exclusively of lagging indicators (revenue and clicks) guarantees budget vulnerability during periods of normal search volatility. High-performance SEO leaders balance reporting across leading and lagging performance tiers to prove continuous engineering progress.
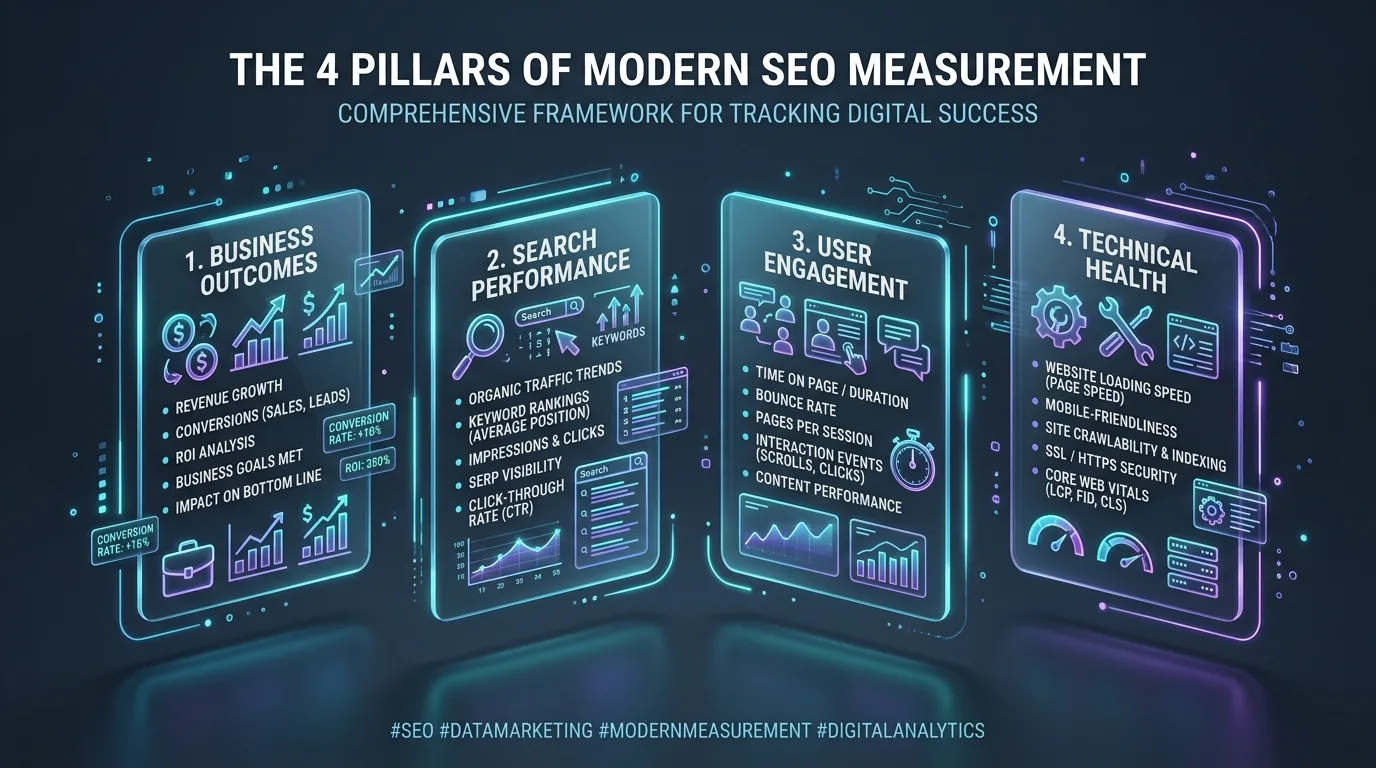
Figure 4: The Strategic SEO Balanced Scorecard — Tracking Leading Technical Agility and Lagging Financial Output.
| Tier | Indicator Type | Core Metrics | Executive Reporting Value |
|---|---|---|---|
| Tier 1: Technical & Operational | Leading | Googlebot crawl frequency on target templates, Core Web Vitals pass rate, indexation velocity. | Proves engineering health before ranking improvements manifest in Google. |
| Tier 2: Search Visibility | Leading | Non-brand GSC impressions, striking distance keyword counts (positions 4-10), SERP snippet CTR. | Demonstrates algorithmic expansion and intent satisfaction across commercial clusters. |
| Tier 3: Commercial Engagement | Lagging | Qualified organic sessions, secondary page transitions to commercial hubs, newsletter signups. | Quantifies lead quality and mid-funnel brand acceleration across high-intent visitors. |
| Tier 4: Enterprise Financial | Lagging (C-Suite) | Direct and assisted pipeline revenue, Customer Lifetime Value (LTV), Organic CAC payback period. | Secures long-term capital investment, protects headcount, and proves organic ROI. |

Chapter 7: Building Real-Time Automated Looker Studio Executive Dashboards
Executives do not log into Google Search Console. They review automated, visual executive dashboards. Designing an enterprise Looker Studio dashboard connected to BigQuery and GA4 requires strict visual discipline: zero clutter, clear trendlines, and immediate financial context.
1. The 3-Page Executive Dashboard Architecture
- Page 1: The CEO & CMO Scorecard: Displays blended organic pipeline revenue, total non-brand organic conversions, year-over-year growth delta, and organic share of voice against primary market competitors.
- Page 2: The Content & Category Hub Matrix: Breaks down organic performance by topic clusters, demonstrating which content hubs (e.g., Guides, Product Pages, Free Tools) generate the highest conversion velocity.
- Page 3: The Engineering & Technical Hygiene Console: Displays real-time HTTP status error rates, Core Web Vitals 75th percentile scores across mobile/desktop, and Googlebot crawl volume trends.
Looker Studio Performance Tip:
Never connect Looker Studio directly to raw GA4 or GSC connectors for large datasets, which results in agonizingly slow dashboard load times and query quota errors. Always query pre-aggregated, partitioned BigQuery summary tables using custom SQL views to ensure instant dashboard rendering.

Chapter 8: Brand vs. Non-Brand Traffic Segmentation in Privacy-First Search
Aggregating branded queries (users typing your exact company name) with non-branded informational searches is the most pervasive flaw in corporate reporting. If your marketing department launches a massive TV, PR, or YouTube ad campaign, branded searches will surge—creating the false illusion that your technical SEO efforts drove the growth. Separating brand and non-brand queries is non-negotiable.
1. Automated Regex Keyword Segmentation in SQL
Maintain an exhaustive regular expression filter that captures your brand name, common misspellings, product trademarks, and executive names. Filter all GSC data into two distinct performance streams:
# SQL Query Filter for Non-Brand Traffic Extraction:
- • Branded Filter Regex: “brand|brandname|brand-name|brandtech|ceo-name”
- • Non-Brand Isolation: Apply
WHERE NOT REGEXP_CONTAINS(LOWER(query), r'brand|brandname|misspelling')inside BigQuery extraction scripts. - • True SEO Growth Indicator: A healthy technical SEO strategy shows upward non-brand impression and click velocity regardless of external brand PR campaigns.
When reporting to executive leadership, present non-brand share of voice as your primary SEO health barometer. While branded traffic reflects general brand awareness created by all marketing channels, non-branded search captures incremental market share from buyers who were unaware of your company prior to querying Google.
Chapter 9: Automated Anomaly Detection and Slack Alerting with Python
Enterprise search teams cannot wait for the monthly reporting cycle to discover that an erroneous robots.txt deployment de-indexed 10,000 URLs or that a staging environment leaked into Google's index. Deploying an automated anomaly detection pipeline that monitors daily BigQuery records ensures immediate incident triage.
1. Statistical Z-Score Anomaly Detection Algorithm
Using a Python script executed via Google Cloud Functions or GitHub Actions on a daily cron schedule, calculate the moving average and standard deviation of organic clicks across all top URL clusters. If a cluster's daily traffic deviates by more than 2.5 standard deviations (Z < -2.5), an automated incident alert triggers directly into the engineering team's Slack channel:
# Automated SEO Anomaly Detection via Python and BigQuery
import numpy as np
import pandas as pd
import requests

def evaluate_traffic_anomaly(historical_df):
    rolling_mean = historical_df['clicks'].rolling(window=30).mean()
    rolling_std = historical_df['clicks'].rolling(window=30).std()

    current_clicks = historical_df['clicks'].iloc[-1]
    expected_mean = rolling_mean.iloc[-2]
    expected_std = rolling_std.iloc[-2]

    z_score = (current_clicks - expected_mean) / expected_std
    if z_score < -2.5:
        send_slack_alert(f"SEO Alert: Organic traffic dropped significantly (Z-score: {z_score:.2f}). Current clicks: {current_clicks} vs Expected: {expected_mean:.0f}")

def send_slack_alert(msg):
    webhook_url = "https://hooks.slack.com/services/ORG/CHANNEL/TOKEN"
    requests.post(webhook_url, json={"text": msg})
By shifting from manual weekly checks to automated algorithmic telemetry, your organization responds to crawl errors, indexing drops, or algorithmic shifts within hours rather than weeks, preventing massive revenue loss.

Ratings & reviews
No reviews yet. Be the first.