
In 2026, Core Web Vitals have matured into the defining technical benchmark of the modern web. What began as a trio of experimental performance metrics has evolved into a rigorous, real-world quality gate enforced by Google's search ranking algorithms, browser performance teams, and digital consumer expectations. With Interaction to Next Paint (INP) permanently cementing its place as the definitive responsiveness metric and rendering the obsolete First Input Delay (FID) an artifact of web history, the performance engineering landscape has fundamentally shifted.
High search rankings, robust conversion rates, and sustainable organic growth in 2026 require far more than passing a simulated Lighthouse audit on a high-speed office fiber connection. Google evaluates websites based on the 75th percentile of actual human page loads gathered across 28-day rolling windows via the Chrome User Experience Report (CrUX). This means a single unoptimized JavaScript vendor script, an uncompressed hero image on a budget smartphone, or an unconstrained programmatic advertisement can silently drag your entire domain below the passing threshold.
This playbook is an exhaustive, developer-grade engineering manual. Spanning diagnostic telemetry, deep metric architectural breakdowns, production-tested code implementations, and continuous delivery pipelines, this guide equips technical SEOs, web architects, and frontend engineers with the exact strategies required to achieve and maintain perfect Core Web Vitals scores across complex modern web architectures.
Chapter 1: The 2026 Core Web Vitals Framework & Mathematical Thresholds
Google evaluates Core Web Vitals as a vital facet of its overall Page Experience ranking criteria. To achieve a "Passing" assessment in Google Search Console, a URL (or aggregate URL group) must satisfy the "Good" threshold for all three core metrics at the 75th percentile across both mobile and desktop device segments.
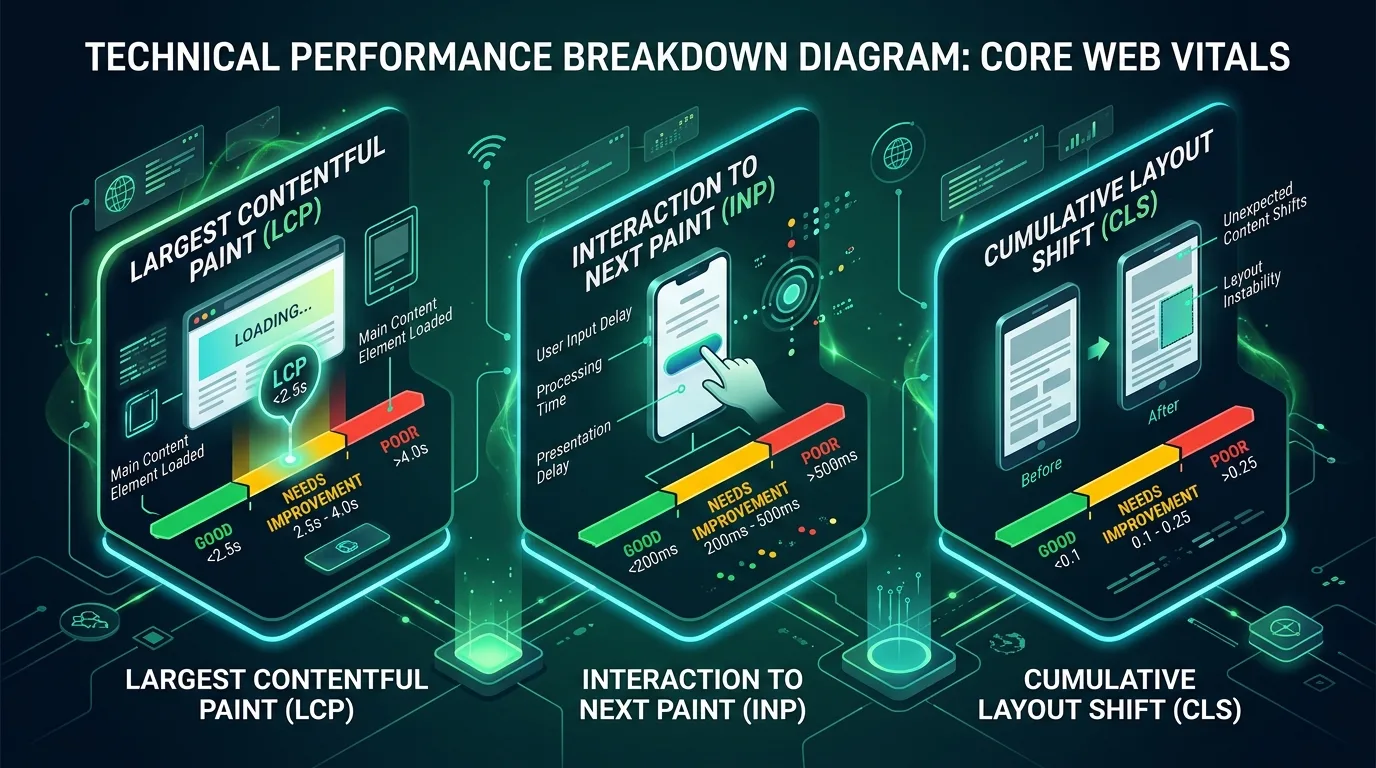
The three Core Web Vitals focus on three distinct, non-overlapping dimensions of user experience: visual loading speed, interactive responsiveness, and visual layout stability. In addition, several diagnostic proxy metrics—notably Time to First Byte (TTFB) and First Contentful Paint (FCP)—serve as critical prerequisites for achieving compliance.
| Metric | User-Centric Dimension | Good (75th Percentile) | Needs Improvement | Poor | Search Impact |
|---|---|---|---|---|---|
| Largest Contentful Paint (LCP) | Perceived Loading Speed. Captures when the primary content element (hero image, heading, or video poster) renders on screen. | ≤ 2.5 seconds | 2.5s – 4.0s | > 4.0 seconds | Core Ranking Signal; direct factor in bounce rate and organic visibility. |
| Interaction to Next Paint (INP) | End-to-End Responsiveness. Measures the latency of clicks, taps, and keyboard inputs across the entire user session. | ≤ 200 milliseconds | 200ms – 500ms | > 500 milliseconds | Core Ranking Signal; critical driver of e-commerce checkout completion and user engagement. |
| Cumulative Layout Shift (CLS) | Visual Stability. Quantifies unexpected structural jumps of visible DOM elements during the session. | ≤ 0.10 unitless score | 0.10 – 0.25 | > 0.25 unitless score | Core Ranking Signal; prevents accidental misclicks, user frustration, and cognitive fatigue. |
| Time to First Byte (TTFB) | Foundational Server Health. Measures time elapsed between navigation request and the first byte of HTML received. | ≤ 800 milliseconds | 800ms – 1800ms | > 1800 milliseconds | Diagnostic metric; hard prerequisite for passing LCP. |
| First Contentful Paint (FCP) | Initial Render Feedback. Marks when the browser renders the first piece of DOM text, image, or non-white canvas. | ≤ 1.8 seconds | 1.8s – 3.0s | > 3.0 seconds | Diagnostic metric; establishes whether initial render pipeline is blocked. |
The 75th Percentile Aggregation Rule Explained
A crucial nuance that many digital teams overlook is the mathematical formulation of Google's evaluation. Google does not judge your site based on the average or median experience. Instead, it sorts every single page visit recorded in the CrUX dataset from best to worst and evaluates the experience at the 75th percentile.
In practical terms: if 74% of your visitors experience an instantaneous 1.2-second LCP on ultra-fast desktop connections, but 26% of your mobile visitors experience a sluggish 3.1-second LCP due to unoptimized 4G routing or resource contention, your page fails Core Web Vitals. Performance optimization in 2026 is fundamentally an exercise in lifting the long tail of lower-end mobile devices and imperfect network environments.
Chapter 2: The Critical Dichotomy: Field Data (CrUX) vs. Lab Data (Lighthouse)
The single most pervasive source of developer confusion is the divergence between "Lab Data" (synthetic tests generated by tools like Lighthouse, PageSpeed Insights simulated runs, or WebPageTest) and "Field Data" (real-world telemetry aggregated in the Chrome User Experience Report and Google Search Console).
Why 90% of Engineering Teams Get Fooled by Lab Scores
It is shockingly common for an engineering lead to run a local Lighthouse audit on a MacBook Pro, celebrate a pristine "100 Performance Score," and then watch in bewilderment as Google Search Console reports extensive Core Web Vitals failures across hundreds of URLs. Understanding why this happens is foundational to effective optimization:
- Zero Synthetic User Interaction: Lighthouse executes an automated, simulated page load. It navigates to the page, records early lifecycle metrics, and terminates the run. It does not scroll through thousands of pixels of dynamically injected DOM content, toggle complex accordions, open slide-out shopping carts, or submit forms. Consequently, Lighthouse cannot measure real Interaction to Next Paint (INP). It can only report Total Blocking Time (TBT) as a rough laboratory proxy.
- Device & Network Homogeneity: Synthetic runs use calibrated, static throttling profiles (typically a simulated Moto G Power on an artificial 4G network). In contrast, field users access your application on real hardware ranging from flagship iPhones to severely memory-constrained $80 Android devices running dozens of background operating system processes.
- Rolling 28-Day Aggregation Lag: When you deploy a performance fix to production today, your synthetic Lighthouse score updates instantly. However, Google Search Console and CrUX will not reflect the full impact of your changes until the 28-day rolling collection window gradually flushes out legacy pre-fix user sessions.
- Dynamic Third-Party Tag Injection: Synthetic test environments frequently bypass geographic consent banners, third-party analytics tag managers, affiliate pixels, and live customer chat widgets that fire exclusively in production for genuine visitors.
| Feature / Attribute | Lab Data (Synthetic / Lighthouse) | Field Data (Real User Monitoring / CrUX) |
|---|---|---|
| Primary Purpose | Debugging, local benchmarking, regression testing in pre-production CI/CD. | Assessing genuine user experience, Google search ranking evaluation. |
| INP Capability | Cannot measure INP directly (uses TBT proxy). | Measures true INP across all user interactions. |
| Reproducibility | Highly reproducible; deterministic conditions. | Non-deterministic; represents diverse distributions of devices, networks, and behaviors. |
| Feedback Loop Speed | Instantaneous (seconds). | Delayed (28-day rolling window in CrUX; real-time in internal RUM). |
Chapter 3: Advanced Diagnostic & Telemetry Stack for 2026
To eliminate performance bottlenecks systematically, you must establish an enterprise-grade diagnostic stack capable of pinpointing the exact line of JavaScript or unoptimized network request responsible for degraded user experiences.
The Long Animation Frames API (LoAF): The Modern Diagnostic Standard
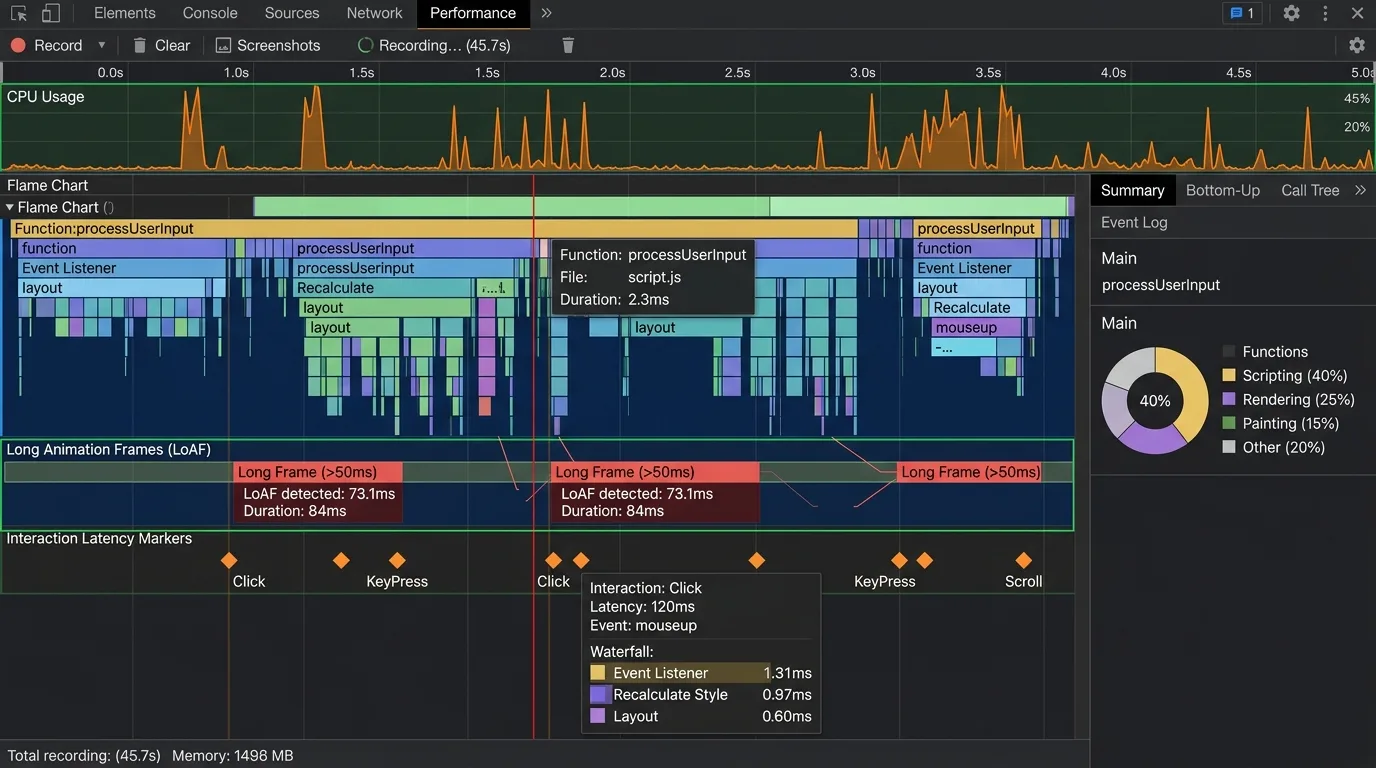
Historically, developers struggled with the Long Tasks API because it only reported that a task exceeded 50ms without identifying the responsible script source or capturing the subsequent layout and rendering delay. In 2026, the Long Animation Frames API (LoAF) provides unprecedented visibility into main-thread execution bottlenecks.
LoAF measures frame updates that are delayed beyond 50ms (or 16.6ms for 60fps displays) and captures the exact scripts, event listener callback durations, style recalculations, and layout phases that contributed to the delay. Implement this production snippet to capture real-user LoAF telemetry:
// Modern Real-Time LoAF Telemetry Observer for Production Environments
if ('PerformanceObserver' in window && PerformanceObserver.supportedEntryTypes.includes('long-animation-frame')) {
    const loafObserver = new PerformanceObserver((entryList) => {
        for (const entry of entryList.getEntries()) {
            // Filter for significant frame delays impacting responsiveness (> 100ms)
            if (entry.duration > 100) {
                const blockingScripts = entry.scripts.map((script) => ({
                    invoker: script.invoker,
                    sourceURL: script.sourceURL,
                    sourceFunctionName: script.sourceFunctionName,
                    sourceCharPosition: script.sourceCharPosition,
                    executionDuration: script.executionDuration,
                    pauseDuration: script.pauseDuration,
                }));

                // Dispatch actionable telemetry to your analytics infrastructure
                const payload = {
                    loafDuration: entry.duration,
                    cpuTime: entry.cpuDuration,
                    renderDelay: entry.duration - entry.cpuDuration,
                    scripts: blockingScripts,
                    timestamp: performance.now(),
                    url: window.location.pathname
                };

                if (navigator.sendBeacon) {
                    navigator.sendBeacon('/api/rum/loaf-telemetry', JSON.stringify(payload));
                }
            }
        }
    });

    loafObserver.observe({ type: 'long-animation-frame', buffered: true });
}
Integrating the Official web-vitals Library
Never wait 28 days for Google Search Console to alert you to a regression. By embedding Google's open-source web-vitals JavaScript library into your application layout, you can sample real-user performance metrics in real time and route them into Google Analytics 4, Datadog, Cloudflare Web Analytics, or your custom time-series database:
import { onLCP, onINP, onCLS, onTTFB } from 'web-vitals/attribution';

function sendToAnalytics(metric) {
    const body = JSON.stringify({
        name: metric.name,
        value: metric.value,
        rating: metric.rating, // 'good' | 'needs-improvement' | 'poor'
        delta: metric.delta,
        id: metric.id,
        navigationType: metric.navigationType,
        // Attribution data exposes the exact element or script causing the issue
        attribution: metric.attribution
    });

    // Use sendBeacon to guarantee delivery during page unload
    (navigator.sendBeacon && navigator.sendBeacon('/api/vitals', body)) ||
    fetch('/api/vitals', { body, method: 'POST', keepalive: true });
}

// Initialize observers with comprehensive attribution data
onLCP(sendToAnalytics);
onINP(sendToAnalytics);
onCLS(sendToAnalytics);
onTTFB(sendToAnalytics);
Chapter 4: The Largest Contentful Paint (LCP) Engineering Manual
Before optimizing individual render paths, ensure your domain has eliminated fundamental crawl inefficiencies and server bottlenecks by reviewing our companion guide on resolving technical SEO crawl errors and site speed.

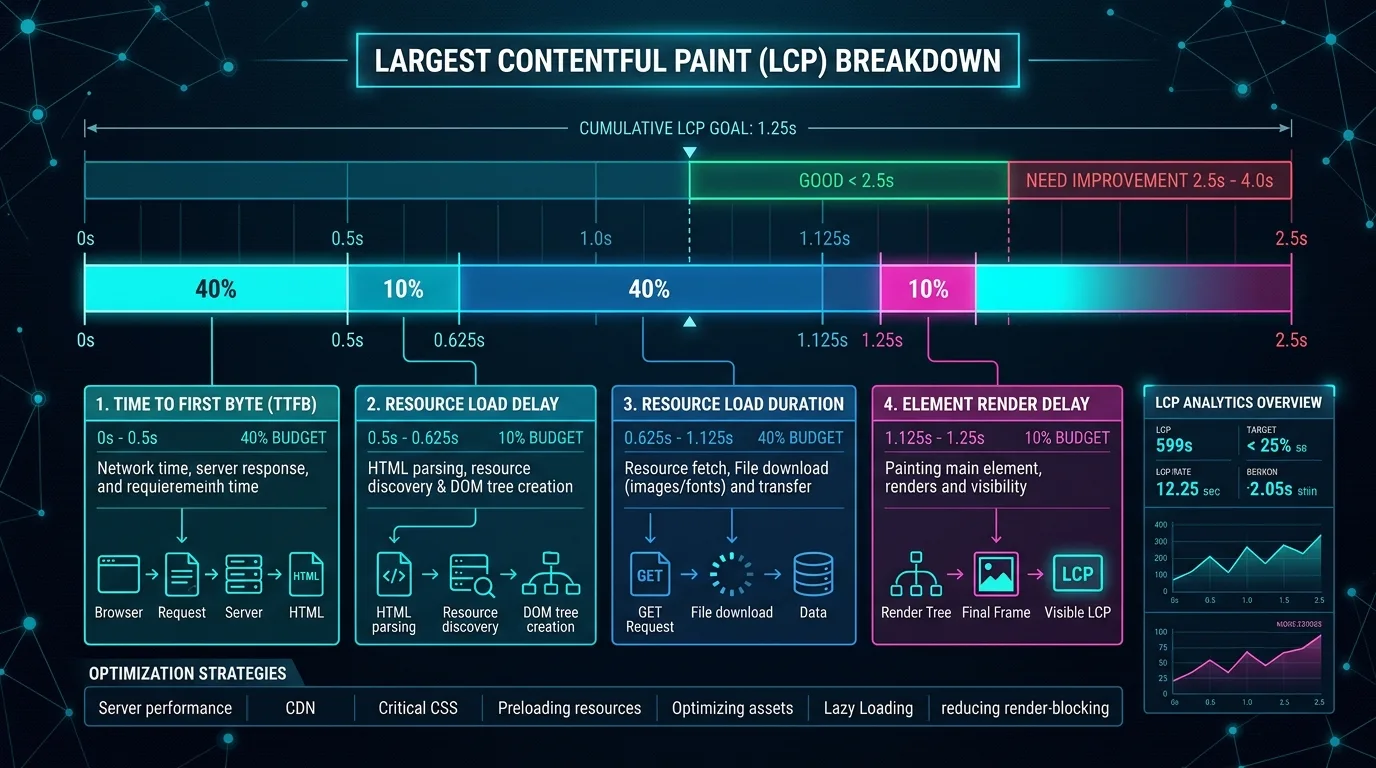
Largest Contentful Paint measures the exact point in time when the largest visible text block, image, or video element within the viewport finishes rendering. In 2026, optimizers must stop treating LCP as a single monolithic duration and instead optimize each of its four sequential sub-parts.
Deconstructing the 4 LCP Sub-Parts
To consistently pass LCP at the 2.5-second threshold, your engineering team must enforce strict sub-budget allocations across the rendering waterfall:
- Time to First Byte (TTFB) — Budget: ≤ 800ms (Ideally < 300ms): The time from the user initiating navigation until the browser receives the first chunk of HTML response. If TTFB takes 1.8 seconds, you have only 700 milliseconds remaining for the browser to download CSS, discover the hero image, fetch it over the network, decode it, and paint it.
- Resource Load Delay — Budget: ≤ 250ms (< 10% of total LCP): The delta between when the browser receives the HTML and when it issues the network request for the LCP resource. In an optimized page, this delay is virtually zero. In an unoptimized page, the LCP image URL is buried deep inside an external CSS file, dynamically injected via client-side JavaScript, or delayed behind render-blocking fonts.
- Resource Load Duration — Budget: ≤ 1,000ms (< 40% of total LCP): The duration required for the browser to stream the bytes of the LCP element over the network. Driven by file weight, connection bandwidth, server concurrency, and CDN edge delivery.
- Element Render Delay — Budget: ≤ 250ms (< 10% of total LCP): The duration between when the LCP resource finishes downloading and when the browser's rendering engine actually paints it to the screen. High render delay is caused by massive render-blocking stylesheets, main-thread JavaScript execution locking the compositor, or complex CSS effects (such as heavy backdrop filters and opacity transitions).
Tactical Engineering Playbook for LCP:
Ensure your LCP image preload tag appears before any asynchronous script declarations in your HTML <head>. Pairing <link rel="preload" as="image" fetchpriority="high"> with responsive media queries guarantees that the browser downloads your hero asset simultaneously with critical CSS.
1. Preload the LCP Element with fetchpriority="high"
The browser's preload scanner scans raw HTML before executing stylesheets or scripts. However, by default, images requested via standard HTML are treated with low or medium network priority until layout calculations confirm they reside in the initial viewport. By explicitly declaring fetchpriority="high", you instruct the browser's network stack to fetch the LCP candidate immediately alongside critical CSS:
<!-- Optimal High-Priority Hero Preload in <head> -->
<link
    rel="preload"
    fetchpriority="high"
    as="image"
    href="/uploads/hero-desktop-1600.avif"
    type="image/avif"
    media="(min-width: 1024px)">

<link
    rel="preload"
    fetchpriority="high"
    as="image"
    href="/uploads/hero-mobile-800.avif"
    type="image/avif"
    media="(max-width: 1023px)">
2. The Fatal Sin: Never Lazy-Load Above-the-Fold Imagery
Perhaps the most widespread self-inflicted LCP disaster is applying loading="lazy" to hero banners, featured blog images, or top product carousels. When an image contains loading="lazy", the browser intentionally postpones initiating the network fetch until the layout engine finishes calculating the page geometry and determines that the element intersects the viewport window. This introduces between 300ms and 1,200ms of completely artificial Resource Load Delay.
| Image Position | Loading Strategy | Fetch Priority | Decoding Mode |
|---|---|---|---|
| Hero / LCP Element | loading="eager" (or omit) | fetchpriority="high" | decoding="async" |
| Below-the-Fold (Content Images) | loading="lazy" | fetchpriority="auto" | decoding="async" |
| Footer / Modal / Offscreen Images | loading="lazy" | fetchpriority="low" | decoding="async" |
3. Modern Next-Gen Image Formats: AVIF vs. WebP
In 2026, browser support for AVIF (AV1 Image File Format) exceeds 96% globally. Compared to standard WebP, AVIF consistently delivers an additional 20% to 35% reduction in file size at equivalent or superior perceptual quality (SSIM/PSNR), with exceptional color gradient preservation and minimal artifacting in high-frequency dark textures. Always implement responsive <picture> syntax with AVIF as the primary source and WebP as the fallback:
<picture>
    <!-- Next-gen AVIF for supported browsers -->
    <source
        type="image/avif"
        srcset="/uploads/hero-400.avif 400w, /uploads/hero-800.avif 800w, /uploads/hero-1600.avif 1600w"
        sizes="(max-width: 640px) 100vw, (max-width: 1024px) 800px, 1200px">

    <!-- Optimized WebP fallback -->
    <source
        type="image/webp"
        srcset="/uploads/hero-400.webp 400w, /uploads/hero-800.webp 800w, /uploads/hero-1600.webp 1600w"
        sizes="(max-width: 640px) 100vw, (max-width: 1024px) 800px, 1200px">

    <!-- Legacy JPG fallback for legacy clients -->
    <img
        src="/uploads/hero-800.jpg"
        width="1600"
        height="900"
        alt="Core Web Vitals Optimization Architecture"
        fetchpriority="high"
        decoding="async"
        class="w-full h-auto rounded-2xl shadow-xl">
</picture>
Chapter 5: The Interaction to Next Paint (INP) Engineering Manual
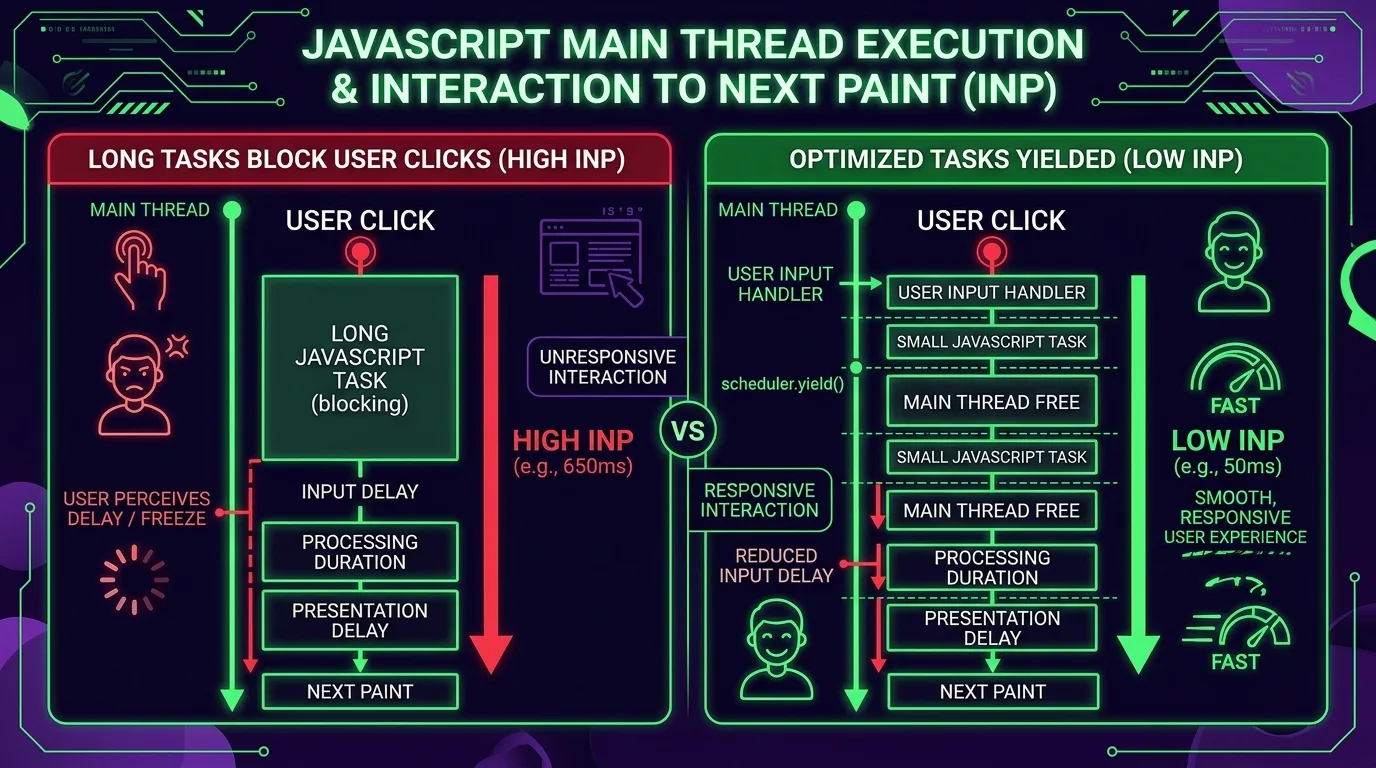
Unlike legacy First Input Delay (FID), Interaction to Next Paint observes every single user tap, click, and keypress until the visitor closes the browser tab. Heavy background tasks triggered 5 minutes into a session (e.g., during checkout or comment submission) can single-handedly trigger a site-wide INP failure.
Interaction to Next Paint (INP) measures the overall responsiveness of your page to user inputs throughout its entire lifecycle. While LCP occurs once during initial load, INP observes every click, tap on mobile, and keypress until the visitor closes the browser tab. The single worst interaction (or 98th percentile for pages with hundreds of interactions) becomes your reported INP score.
The 3 Anatomical Phases of an Interaction
Every interaction is mathematically broken into three distinct latency windows:
- Input Delay (Time to First Callback Execution): The duration between when the user taps their screen and when your JavaScript event listener actually begins executing. High input delay is caused by background main-thread saturation—such as third-party tag managers parsing scripts, massive JSON deserialization, or long-running framework hydration passes.
- Processing Duration (Callback Execution Time): The synchronous execution time required by your event callbacks to process business logic, mutate application state, and update the DOM tree.
- Presentation Delay (Time to Frame Paint): The duration after your callback finishes, during which the browser recalculates styles, computes CSS layout geometry, paints graphic layers, and composites the final pixels to the physical display buffer.
Tactical Engineering Playbook for INP:
1. Yielding to the Main Thread: scheduler.yield()
In modern web applications, large synchronous tasks freeze the browser's compositor thread. When a user clicks an interactive control while a 250ms task is executing, the click sits queued in the operating system buffer, resulting in an immediate INP failure. The modern native solution is scheduler.yield(), which breaks monolithic loops into discrete micro-tasks, allowing the browser to draw visual feedback between iterations:
// Enterprise Production Yielding Utility for 2026 Frontend Applications
export async function yieldToMainThread() {
    // Native Chromium Task Scheduler API (Available in modern browsers)
    if ('scheduler' in window && typeof window.scheduler.yield === 'function') {
        return await window.scheduler.yield();
    }

    // Polyfill fallback: queue task at the tail of the event loop
    return new Promise((resolve) => {
        setTimeout(resolve, 0);
    });
}

// Example: Processing a massive 10,000-item e-commerce filter list without freezing INP
async function renderFilteredCatalog(items) {
    showFilteringIndicator(); // 1. Immediate visual feedback (
2. Framework Hydration Optimization: Selective & Island Architectures
In traditional Single Page Applications (SPAs) built with React, Vue, or Angular, full-page hydration is the primary driver of catastrophic mobile INP. When client-side JavaScript boots, it re-executes all component trees to attach event listeners, completely locking the main thread for 1.5 to 3.5 seconds on mid-tier mobile CPUs.
- Transition to Islands Architecture (Astro, Fresh): Ship 100% static HTML by default and hydrate only the interactive "islands" (e.g., search autocomplete, shopping cart modal).
- React 19 Concurrent Features: Wrap non-urgent state updates inside
startTransitionso the React reconciler can pause rendering when the user triggers a new interaction:
import { useState, useTransition } from 'react';

function SearchFilterComponent() {
    const [searchTerm, setSearchTerm] = useState('');
    const [filteredResults, setFilteredResults] = useState([]);
    const [isPending, startTransition] = useTransition();

    const handleSearchInput = (e) => {
        const nextValue = e.target.value;
        // Urgent update: render input field text immediately (guarantees  {
            const results = computeHeavySemanticSearch(nextValue);
            setFilteredResults(results);
        });
    };

    return (
        <div>
            <input type="text" value={searchTerm} onChange={handleSearchInput} />
            {isPending && <span class="spinner">Updating catalog...</span>}
            <ResultsList items={filteredResults} />
        </div>
    );
}
Chapter 6: The Cumulative Layout Shift (CLS) Engineering Manual
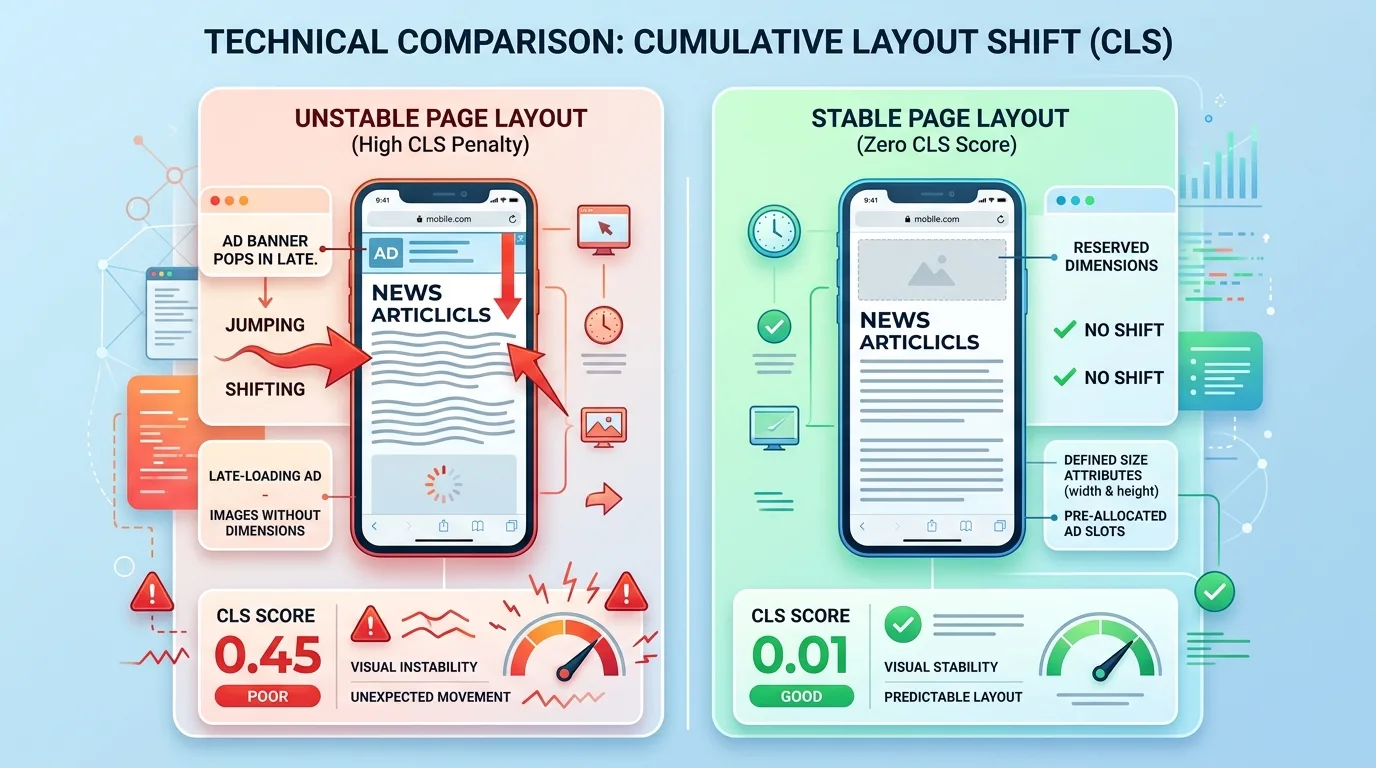
Cumulative Layout Shift (CLS) measures the visual stability of a webpage. It calculates the sum of all unexpected layout shift scores for every animated or dynamically inserted DOM element that moves from its starting coordinate without being initiated by a direct user action (such as clicking an accordion link).
The Mathematical Formulation of CLS
Google calculates the layout shift score using the product of two distinct fractions:
Layout Shift Score = Impact Fraction × Distance Fraction- Impact Fraction: Measures how much total viewport area was affected by the moving element across two consecutive rendering frames (e.g., if an element occupying 50% of the screen moves downwards by 20%, the combined impacted area is 70% = 0.70).
- Distance Fraction: The greatest horizontal or vertical distance that unstable elements moved relative to the viewport dimension (e.g., moving 200px vertically on a 1000px tall screen = 0.20).
- Resulting Shift: \(0.70 imes 0.20 = 0.14\) (Which instantly pushes the page past the 0.10 "Good" threshold into the "Needs Improvement" penalty box).
Tactical Engineering Playbook for CLS:
1. Always Declare Explicit Aspect Ratios or Fixed Dimensions
Modern browsers utilize modern CSS aspect-ratio calculations to reserve the exact layout footprint of images and responsive embeds before the graphic file is downloaded over the network. Never output raw <img> tags without width and height attributes:
/* Global Layout Stability CSS Reset */
img, video, iframe, embed, object {
    max-width: 100%;
    height: auto;
    /* Enforce hardware aspect-ratio mapping */
    aspect-ratio: attr(width) / attr(height);
}

/* For responsive dynamic cards with unknown asset dimensions */
.card-media-placeholder {
    width: 100%;
    aspect-ratio: 16 / 9;
    background-color: var(--color-surface-skeleton);
    contain: layout paint;
}
2. Dynamic Slot Pre-Allocation for Programmatic Advertisements
Dynamic programmatic advertisements (Google AdSense, Prebid.js, Taboola) are the leading cause of catastrophic CLS on media and publisher websites. When ad bidding completes 2.5 seconds after page load and an ad banner expands from 0px to 250px height, all article text below the fold jumps downwards.
The Fix: Pre-allocate a wrapper container dimensioned to the largest common ad unit that can serve within that slot, and utilize CSS flex centering to accommodate smaller creative variants without triggering layout recalculations:
<!-- Pre-allocated Stable Ad Container -->
<div class="ad-slot-wrapper" style="min-height: 280px; min-width: 336px; display: flex; align-items: center; justify-content: center; background: #f8fafc;">
    <div id="gpt-ad-leaderboard-slot"><!-- Dynamic ad renders here with zero layout shift --></div>
</div>
3. Font Loading Stability: Eliminating FOIT and FOUT Layout Shifts
When custom web fonts load, they often have different font metrics (x-height, glyph width, ascent, and descent) compared to the system fallback font (Arial, Times New Roman, or system-ui). When the web font swaps in, entire paragraphs reflow, causing words to break across new lines and shifting subsequent headings.
The Fix: Utilize CSS font-display: optional for non-critical fonts, or leverage modern CSS metric override descriptors (size-adjust, ascent-override, descent-override) to perfectly align your fallback font geometry with your web font:
/* Fallback font aligned perfectly with Inter web font metrics */
@font-face {
    font-family: 'Inter-Fallback';
    src: local('Arial');
    ascent-override: 90.49%;
    descent-override: 22.56%;
    line-gap-override: 0.00%;
    size-adjust: 107.41%;
}

body {
    font-family: 'Inter', 'Inter-Fallback', sans-serif;
}
Chapter 7: Server, CDN & Infrastructure Optimization for 2026
Front-end optimizations can only succeed when anchored by high-performance edge infrastructure. In 2026, server response latency is dictated by edge compute, modern transport protocols, and speculative prefetching.
1. Implementing the Speculation Rules API for Instant Page Transitions
The Speculation Rules API is the cutting-edge standard that supersedes legacy <link rel="prefetch">. It allows frontend architectures to dynamically pre-render subsequent pages in an invisible background background tab when a user hovers or begins scrolling toward an internal navigation link. When the user clicks, the page transition is literally 0 milliseconds LCP and 0 milliseconds INP:
<!-- Speculative Pre-rendering Rule injected in <head> -->
<script type="speculationrules">
{
    "prerender": [
        {
            "source": "list",
            "urls": ["/blog/next-article", "/pricing"],
            "score": 0.8
        },
        {
            "where": { "href_matches": "/blog/*" },
            "eagerness": "moderate"
        }
    ]
}
</script>
2. HTTP/3 and 0-RTT Connection Resumption
HTTP/3 over QUIC resolves head-of-line blocking by running over UDP rather than TCP. On fluctuating mobile networks where packets frequently drop, HTTP/3 allows unrelated resource streams to continue uninterrupted. Enforce HTTP/3, TLS 1.3, and 0-RTT (Zero Round-Trip Time) session resumption across your CDN distribution (Cloudflare, Fastly, or CloudFront) to slash global mobile TTFB by up to 250ms.
Chapter 8: Framework-Specific Optimization Strategies
Optimizing Next.js & React 19 Applications
- Replace Next/Font runtime generation with static font-preload: Avoid heavy layout shift during hydration.
- Adopt Server Actions and React Server Components (RSC): Minimize the client-side JavaScript bundle shipped over the wire. Every kilobyte of JavaScript eliminated from the client directly improves INP.
- Image Component Configuration: Ensure
<Image priority />is applied strictly to the hero asset and thatplaceholder="blur"is backed by lightweight inline base64 data to avoid layout jumping.
Optimizing WordPress & Headless CMS Platforms
- Disable Emojis, Gutenberg Block Library Bloat, and Legacy Dashicons: Dequeue unnecessary core stylesheets that inject render-blocking CSS across all page templates.
- Full Page Object Caching with Redis & Edge HTML Caching: Cache dynamic PHP-generated HTML pages in Redis memory or directly at the Cloudflare edge cache (Cache Everything rule), bypassing MySQL queries and dropping TTFB from 900ms down to 80ms.
- Script Deferral and Delay: Utilize tools like FlyingPress or Perfmatters to delay non-critical JavaScript execution until first user interaction, liberating the main thread during initial page load.
Chapter 9: Real-World Case Studies & Troubleshooting Walkthroughs
Case Study 1: Enterprise E-Commerce Store Drops Mobile INP from 680ms to 78ms
The Problem: An international fashion retailer experienced an 8% drop in organic visibility following Google's full transition to INP. Field telemetry revealed that tapping product size-selector buttons and clicking "Add to Cart" suffered median interaction latencies of 680ms, triggering widespread "Poor" classifications.
The Root Cause: A monolithic third-party analytics tag manager was listening to every global click event and executing four heavy synchronous telemetry serialization scripts before allowing the React click handler to run. Furthermore, the size-selector component was re-rendering the entire 80-item product catalog DOM tree synchronously on every click.
The Engineering Solution:
- Migrated the third-party tag telemetry into a dedicated Web Worker utilizing
Partytown, completely freeing the browser main thread. - Wrapped the catalog filtering logic inside React's
startTransitionand utilizedscheduler.yield()to break DOM reconciliation tasks. - The Result: 75th percentile INP dropped from 680ms to 78ms ("Good"). Within six weeks, organic search traffic rebounded by 14% and mobile checkout completion increased by 6.2%.
Case Study 2: High-Traffic News Publisher Slashes LCP from 4.8s to 1.3s
The Problem: A digital magazine suffered catastrophic LCP scores across mobile devices, with median page loads averaging 4.8 seconds.
The Root Cause: The hero image was dynamically discovered via client-side JavaScript, lazy-loaded via an unoptimized legacy jQuery plugin, and formatted as a 1.8MB uncompressed PNG served directly from an origin Apache server without CDN edge caching.
The Engineering Solution:
- Automated AVIF conversion pipeline generating responsive 400px, 800px, and 1400px variants.
- Replaced client-side script discovery with server-side rendered HTML containing
<link rel="preload" fetchpriority="high" as="image">in the document head. - Routed origin traffic through a global CDN with Edge HTML caching.
- The Result: LCP plummeted from 4.8s to 1.3s, shifting 94% of URLs into the green "Good" bracket and driving a 22% reduction in mobile bounce rate.
Chapter 10: Building an Automated Performance CI/CD Pipeline
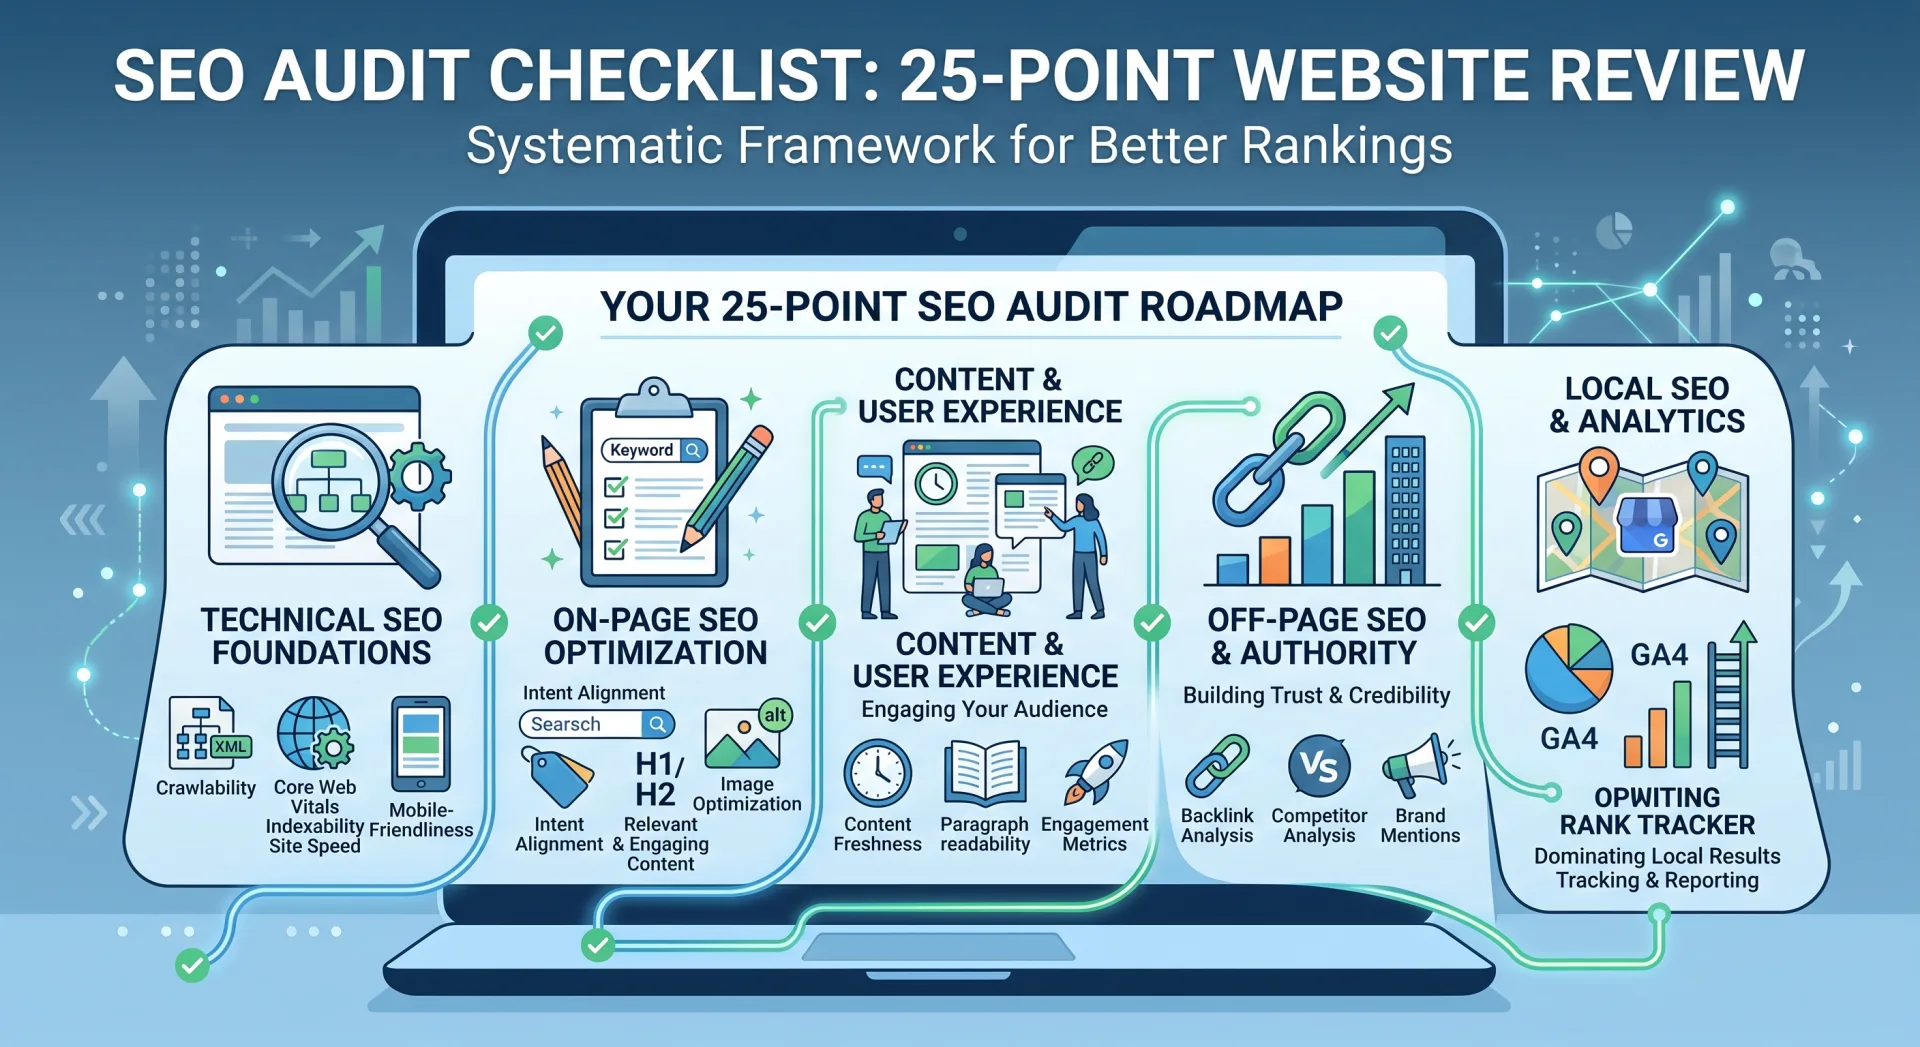
Automating performance verification works hand-in-hand with site-wide quality assurance. For a systematic audit framework, cross-reference your deployment pipeline with our 25-Point SEO Audit Checklist.
Performance optimization cannot remain an ad-hoc debugging drill. To prevent regressions from slipping into production, world-class engineering teams implement automated performance budgets inside their GitHub Actions or GitLab CI/CD pipelines.
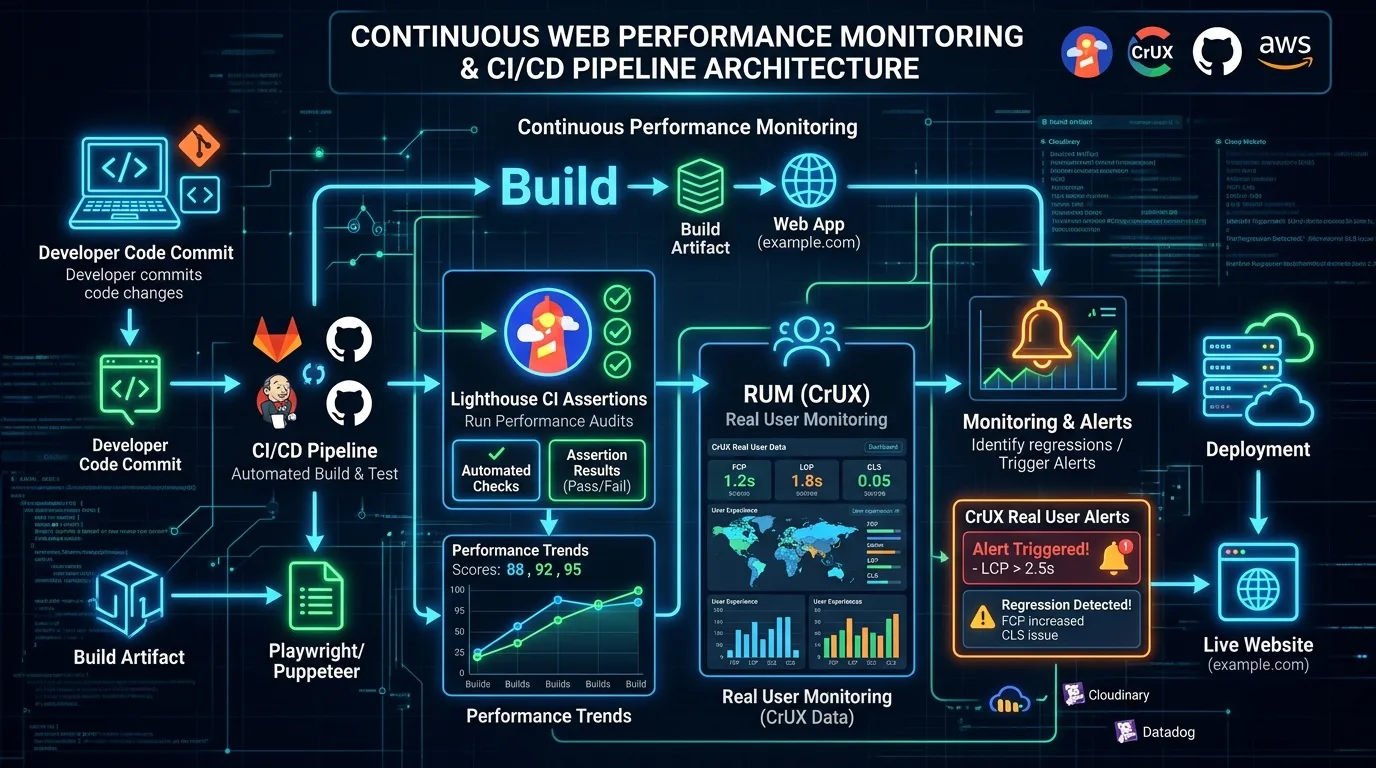
Production GitHub Actions Workflow for Performance Assertion:
name: Performance & Core Web Vitals CI Gate

on:
  pull_request:
    branches: [main]

jobs:
  performance-audit:
    runs-on: ubuntu-latest
    steps:
      - name: Checkout Source Code
        uses: actions/checkout@v4

      - name: Setup Node.js Environment
        uses: actions/setup-node@v4
        with:
          node-version: 20
          cache: 'npm'

      - name: Install Project Dependencies
        run: npm ci

      - name: Build Application Artifacts
        run: npm run build

      - name: Execute Automated Lighthouse CI Audit
        uses: treosh/lighthouse-ci-action@v11
        with:
          urls: |
            http://localhost:3000/
            http://localhost:3000/blog/core-web-vitals-optimization-playbook-2026
          uploadArtifacts: true
          temporaryPublicStorage: true
          budgetPath: ./performance-budget.json
          runs: 3
The performance-budget.json Configuration:
[
  {
    "path": "/*",
    "timings": [
      {
        "metric": "largest-contentful-paint",
        "budget": 2000
      },
      {
        "metric": "cumulative-layout-shift",
        "budget": 0.05
      },
      {
        "metric": "total-blocking-time",
        "budget": 150
      }
    ],
    "resourceSizes": [
      {
        "resourceType": "script",
        "budget": 250
      },
      {
        "resourceType": "image",
        "budget": 500
      },
      {
        "resourceType": "total",
        "budget": 1200
      }
    ]
  }
]
Frequently Asked Questions (FAQ)
1. Why did Google officially replace FID with INP?
First Input Delay (FID) only captured the delay before the *first* interaction began processing during initial page boot. Once the page finished loading, FID stopped measuring completely. This allowed websites to achieve perfect green FID scores while remaining completely frozen and unresponsive when users interacted with modals, dropdowns, or filters later in their session. Interaction to Next Paint (INP) measures responsiveness across all clicks, taps, and keypresses throughout the entire session, holding developers accountable for ongoing runtime performance.
2. Does passing Core Web Vitals guarantee a #1 organic ranking on Google?
No. Google utilizes hundreds of ranking factors, with topical relevance, search intent satisfaction, content authority, and backlink equity remaining primary. Core Web Vitals act as an authoritative quality gate and powerful tie-breaker. If two competing domains publish equally comprehensive guides on a query, the domain that passes Core Web Vitals will consistently outrank the sluggish, unstable competitor. Furthermore, failing Core Web Vitals damages user retention, inflates bounce rates, and degrades direct business conversions.
3. Why does my local Lighthouse audit show 100 while Google Search Console reports a failure?
Lighthouse runs in a synthetic environment without real user interaction, meaning it cannot measure true INP and under-represents layout shifts that occur during scrolling. Google Search Console aggregates real-world field telemetry (CrUX) from thousands of real human visitors on diverse devices, network conditions, and locations over a rolling 28-day window. Google ranks your site based on field data, not your local Lighthouse score.
4. What is considered a "good" Time to First Byte (TTFB) in 2026?
Under Google's current diagnostic guidelines, a good TTFB is under 800 milliseconds, but modern edge architectures should target under 300 milliseconds. Because TTFB represents the foundational prerequisite for LCP, an 800ms TTFB consumes nearly one-third of your entire 2.5-second LCP budget before a single byte of CSS or imagery has been parsed.
5. Can CSS animations or transitions cause CLS penalties?
Yes, if you animate layout-inducing CSS properties like top, left, margin, padding, or height. Animating these properties forces the browser to recompute layout geometry on every frame. To create smooth, zero-CLS animations, animate exclusively composite properties: transform: translate3d(...), transform: scale(...), and opacity, which execute directly on the GPU without triggering layout recalculations.
6. How does the Long Animation Frames (LoAF) API differ from Long Tasks?
The legacy Long Tasks API only reported that a task exceeded 50ms without identifying the contributing script URL, function name, or layout delay. The LoAF API provides detailed attribution: it records frame updates taking longer than 50ms and captures the exact script sources, execution durations, and presentation rendering delays responsible for interaction latency.
7. Will preloading too many assets harm my Core Web Vitals?
Yes. Preload bandwidth is not infinite. If you preload five web fonts, three CSS files, and multiple images, they will compete for network bandwidth on HTTP/2 or HTTP/3 streams, creating resource contention that delays critical assets. Reserve rel="preload" and fetchpriority="high" strictly for the single LCP candidate image and critical hero font.
8. How quickly will my Google Search Console report update after deploying a fix?
Google Search Console operates on a rolling 28-day aggregate window from CrUX. When you deploy a fix, you will see daily incremental improvements in field data within 3 to 7 days, but the full impact will take 28 continuous days to fully replace pre-fix data. Use internal RUM tools (such as the web-vitals library) to verify improvements in real time.
Actionable 2026 Core Web Vitals Implementation Checklist
- [ ] Audit real-user 75th percentile mobile metrics in Google Search Console and CrUX API.
- [ ] Preload the critical LCP hero asset using
<link rel="preload" fetchpriority="high" as="image">in<head>. - [ ] Audit template code to ensure no above-the-fold hero image contains
loading="lazy". - [ ] Convert all hero and editorial imagery to responsive AVIF formats with WebP fallbacks.
- [ ] Implement
scheduler.yield()or chunking utilities across all heavy JavaScript event handlers. - [ ] Offload non-critical third-party analytics and chat widgets to Web Workers via Partytown.
- [ ] Wrap non-urgent client-side state mutations inside React 19
startTransition. - [ ] Ensure all images, videos, and dynamic containers declare explicit width/height or CSS
aspect-ratio. - [ ] Pre-allocate fixed min-height containers for all programmatic advertisement units and cookie banners.
- [ ] Align fallback font metrics with web fonts using
size-adjustandascent-overridedescriptors. - [ ] Deploy the Speculation Rules API for instant pre-rendering of high-confidence internal navigations.
- [ ] Integrate continuous RUM telemetry using the official Google
web-vitalsJavaScript library. - [ ] Enforce automated performance assertion budgets in GitHub Actions via Lighthouse CI.

Ratings & reviews
No reviews yet. Be the first.